Monthly Market Pulse
March 2025
What are the charts telling us this month?
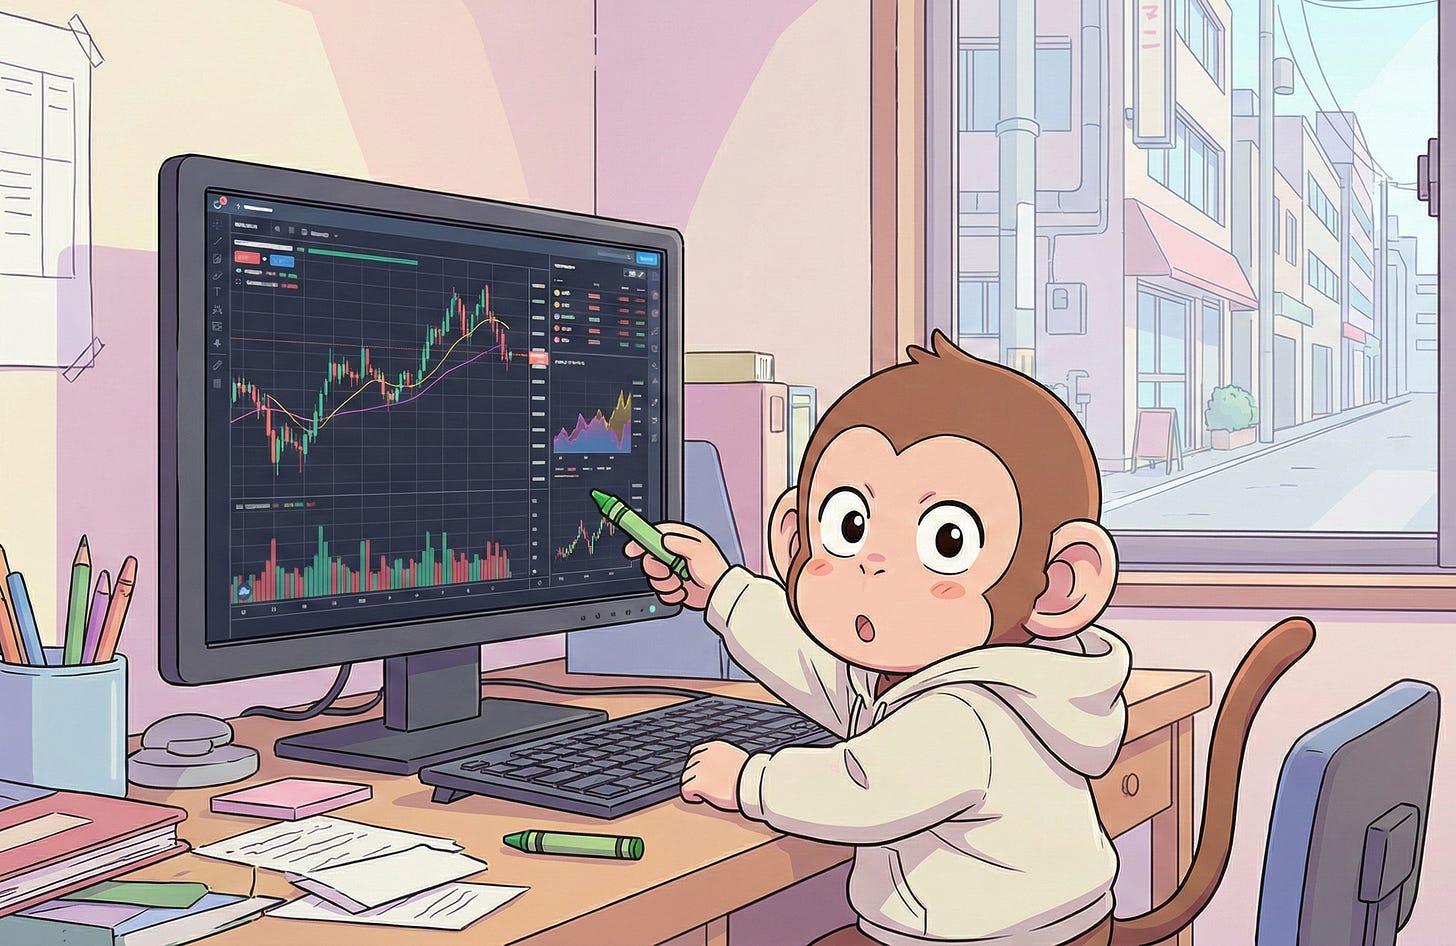
Technicals tell a story, an ape who dismisses charting as mumbo jumbo is the clown in the house
- Taro Sakamoto
Parameters: 10-Yr Weekly Charts
-> 50 Week-Moving Average (Orange)
-> 200 Week-Moving Average (Blue)
-> RSI (Top Panel), MACD (Middle Panel), Stochastic RSI (Bottom Panel)
-> Valuation Bands (Average, +-…


